Not too long ago I wrote a post on the Search Engine Land site about advanced filters and how they’re an amazing alternative to regular expression (AKA regex)**. But it’s a little complex at first, though much easier to learn than regex. So I wanted to do a video tutorial but never got around to it. But then a client who needed a reporting dashboard for their PPC campaigns wanted me to do something that required me to use advanced filters.
Download Excel File
If you’d like to download the Excel file I used, you can access it here. Feel free to kick it around and test out some of the filters I demonstrate in the video.
Why I Chose To Use Advanced Filters
I may have been able to do it formulaicly, but a keyword phrase could fit into several different categories. And IF functions are a little more linear. For example, with nested IF statements you might set up the following criteria: Does it meet criteria X? If yes, do Y. If no, see if it meets any of these other criteria. But with advanced filters, much like regex, I know that I can use as many criteria as I want to cherry pick the exact data I want to use for analysis.
The Need
So what they wanted was for me to take the list of keywords they bid on, organize them into intuitive categories, and then pull in the competition and search volume numbers from their main dataset. Advanced filters are perfect for this job because it’s very easy (as you’ll see) to create criteria to break larger datasets into smaller ones.
What I Did With The Filtered Data
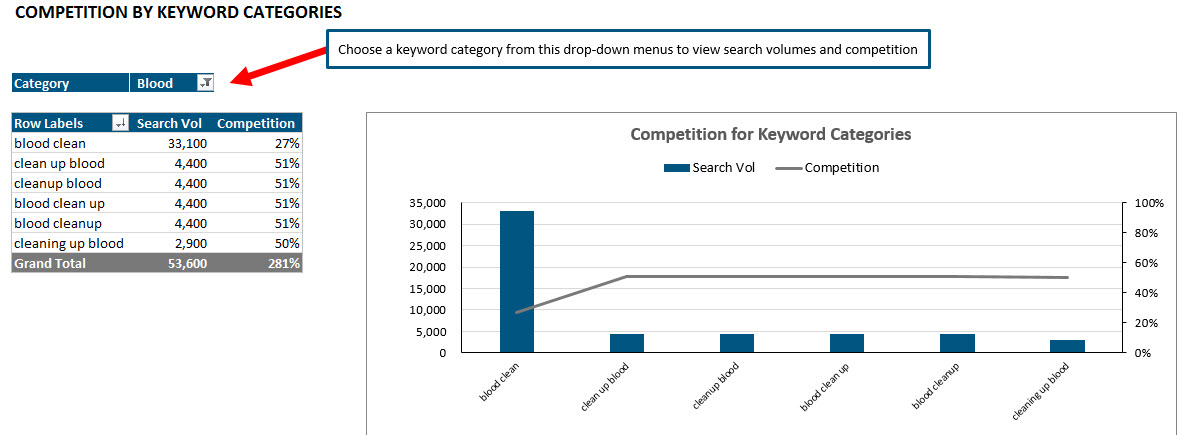
Ultimately what I did with these individual datasets was reunite them into a single dataset, with Category as a new column and created a cool pivot chart from that dataset. That pivot chart used something called a report filter that allows them to isolate a particular category of keywords and see just the search volumes and competition values for the keywords in that category. It looked like this:

Video Tutorial
So I created a tutorial to demonstrate how I used advanced filters to create subsets of my original. I will probably do a follow-up video to show how I created the pivot chart. I also want to do another video demonstrating more advanced uses of advanced filters, like creating criteria using formulas. That is exactly what makes them more powerful than regex.
Let me know if you have any questions in the comments below.
**I still think it’s important for us, as marketers, to learn how to use regex, especially if you’re working with web analytics at all. If you want to learn, I wrote a comprehensive guide for non-programmers in plain English. All of my examples are from Google Analytics. I made it my goal one Saturday to learn the dark art and have been really glad I did.

Hey Annie,
This is great stuff, downloaded the file and reproduced everything at every step, but I’m now trying to reverse engineer how you did the “Keyword Competition Analysis” tab with the pivot chart – the part I can’t figure out is how did you manage to create the pivot with the keyword data AND the category data, and get the category data to control the keyword data (and therefore the pivot chart)?
Thanks!
David
@dportney
David,
I’ll tell you what … I’ll do a follow up video on how to create the pivot chart. Hopefully you’re on a PC though b/c pivot charts are PC-swim only. I’ll try to remember to come back and let you know when I’ve posted it, but it should be sometime in the next week.
Hi, I found it really interesting…. Thanks for sharing.
Any news on the follow up video??
Thanks again
Giovanni
Thanks! I should have the follow-up video posted within the week. 🙂