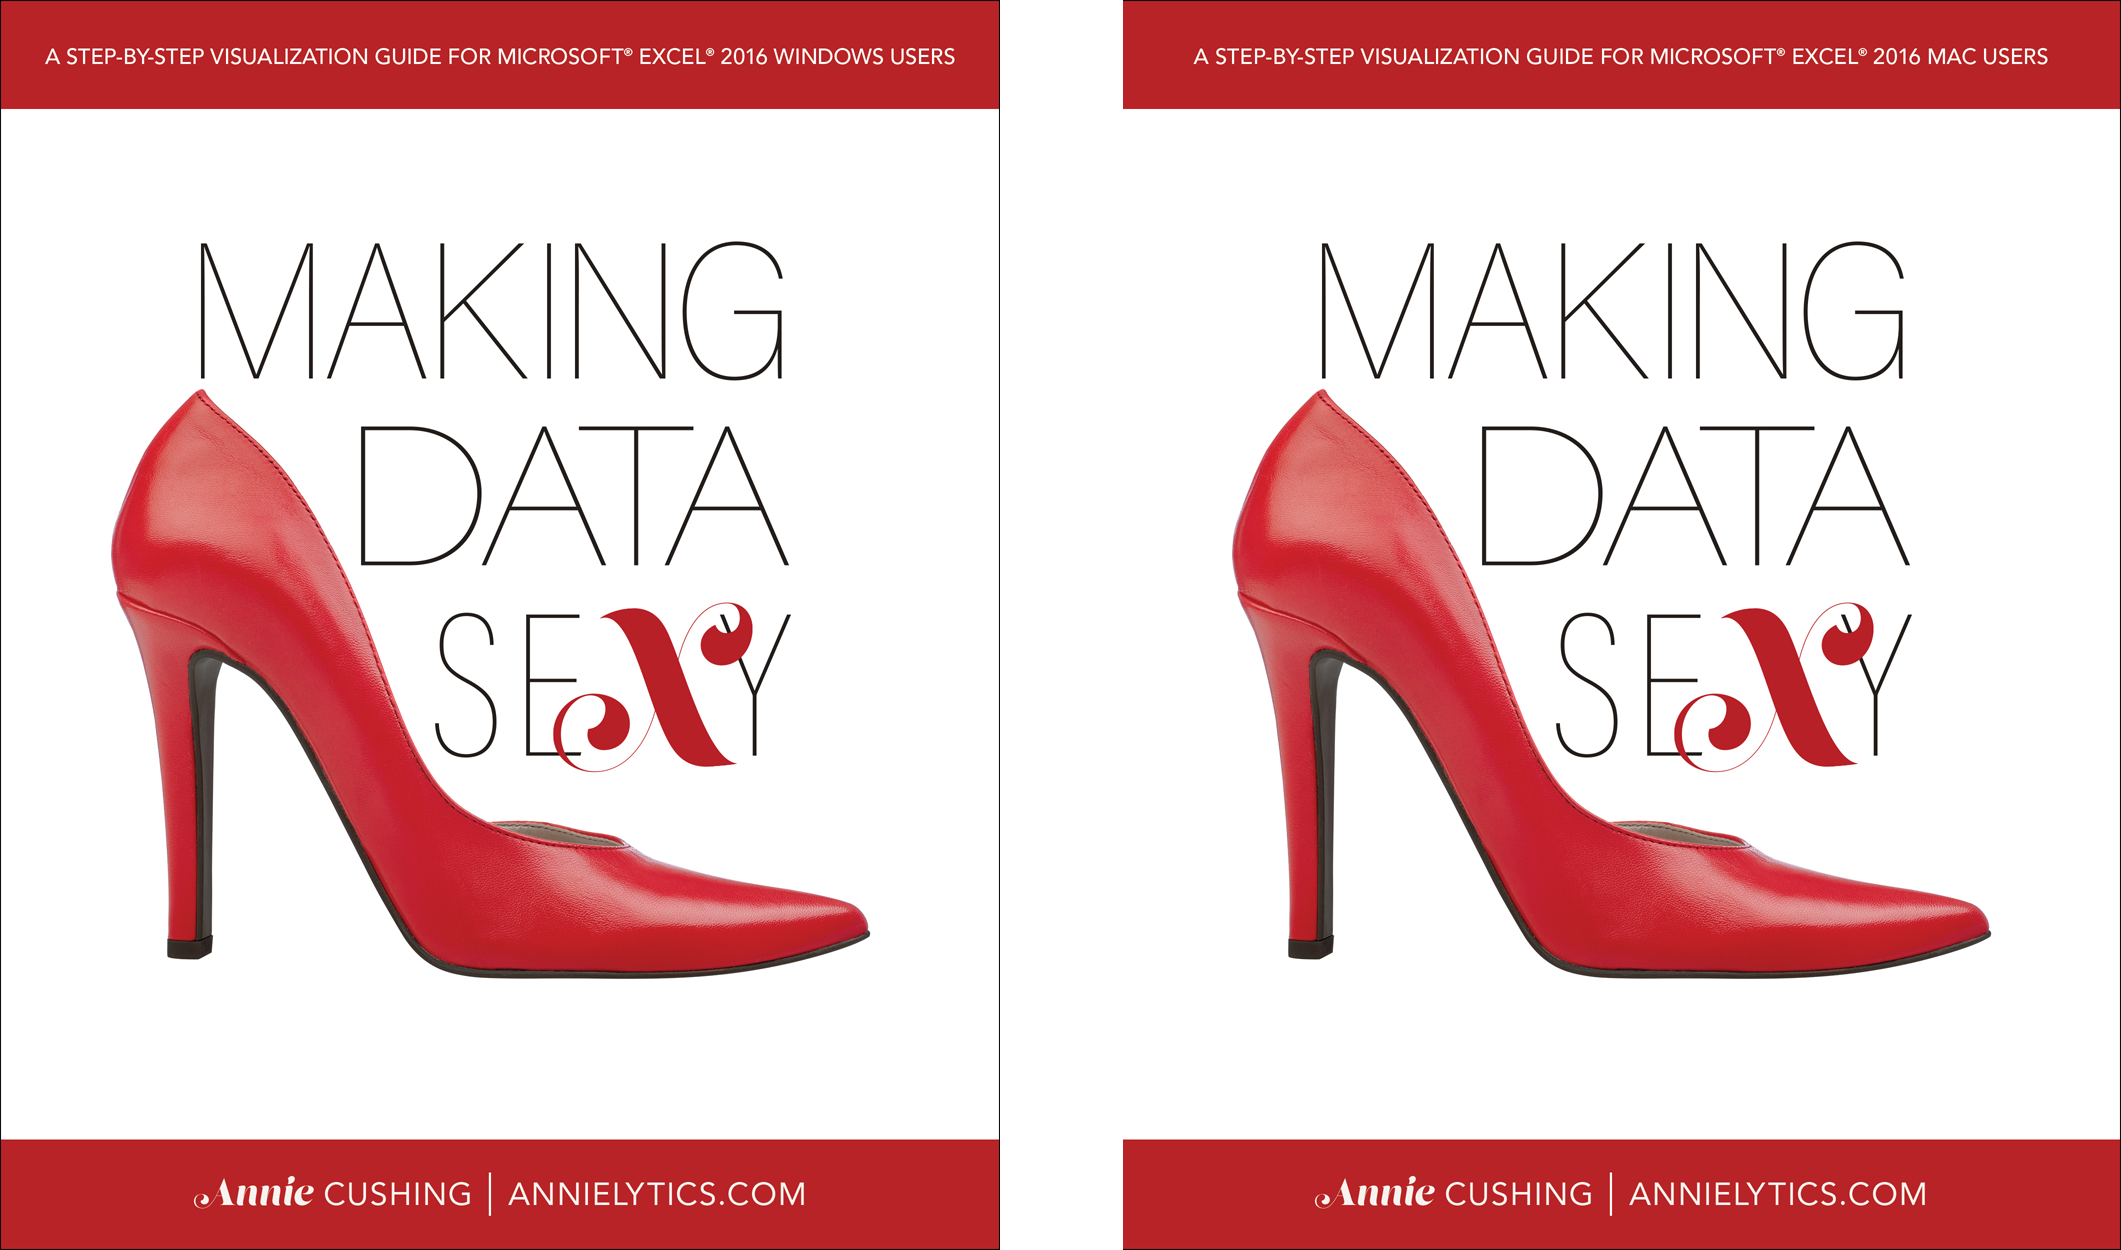
You may have noticed I’ve been a little quiet for a little more than a year. That’s because I’ve been feverishly working on the largest project of my career (hopefully my life!): Making Data Sexy.
I wrote two separate books because I have 0 regard for my mental health. And I waited to publish them together because I have 0 regard for my financial portfolio (or mental health).
One is for Windows users. (No surprise there. You guys get all the Excel books.?) But this time we Mac users get our own version!

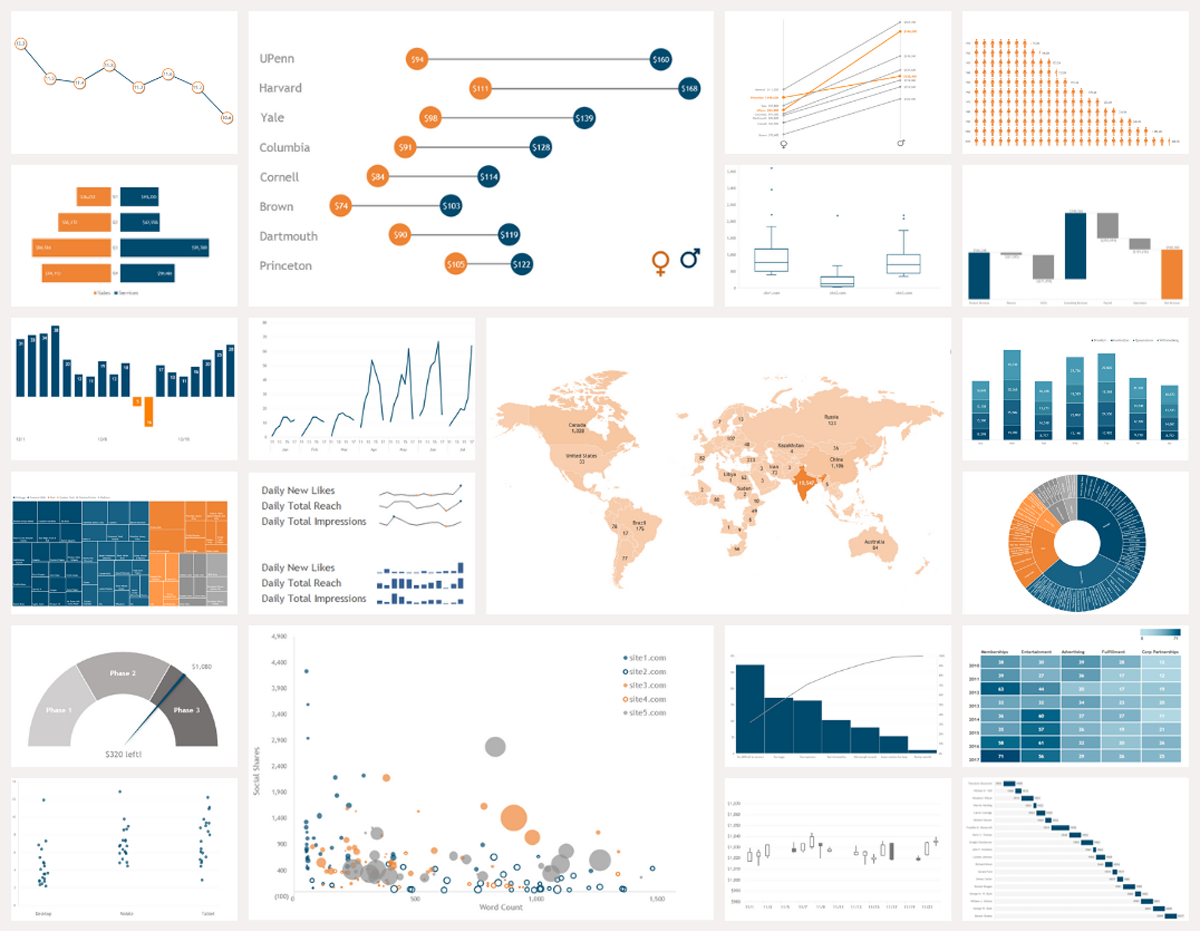
Making Data Sexy will walk you through how to create 60+ visualizations in Excel, with a laser-like focus on making charts that are clear, compelling, and very sexy! I worked from a three-color palette (really a two-color palette with gray thrown in) to demonstrate that even the smallest organization can create visualizations that align with their branding.
Gallery
Want to see a fully gallery of the charts in the book because you’re not easily convinced and also aren’t into reading? I respect that. You can view it here.
Look Inside on ‘Roids
Amazon has been in no hurry adding the Look Inside feature to all the books. They added it to the Kindle but not the print books. And, as an author, you have no control over what pages they pull. So I made my own Look Inside, pulling pages from different chapters from the book. You can download it here.
Features
This book focuses exclusively on data visualization. Although you will learn how to rock formulas to clean and organize your data, create and design pivot tables, and create themes and templates to automate your workflow, the overarching focus of this book is on data visualization.
To that end, some of the more notable features of the book include:
- The focus is on creating elegant, branded visualizations. You will learn to rid your charts of distracting (and ugly!) pixels, such as gridlines, busy axes, etc.
- You will learn to hack Excel. Microsoft never intended us grabby little Excel users to be able to create really cool charts, like the slope, dumbbell, bikini, gauge, segmented scatterplot, etc. But you will learn to hack obscure settings in Excel to make these hacktastic charts possible. And I explain why every step of the way. If I tell you to go into the Error Bars setting, I explain why we’re using error bars to create our lollipops or a connected scatter plot to add a mean line to our chart.
- Tutorials are written in plain English. When learning a new skill, there are few things as frustrating as going through the motions of a tutorial without understanding the strategy. In Making Data Sexy, you will learn the why behind the how in every tutorial. To ease you into the tutorials for the more complicated charts, I include a “Hundred-Foot View” section, which is designed to put you in the catbird seat so that you will feel more confident when I ask you to do something ridiculous…like shoehorn a pie chart into a donut chart like it’s some kind of host organism. ?
- The book is scannable. Paragraphs have been replaced with bulleted lists and numbered steps whenever possible to make consumption as easy (and fast) as possible.
- The tone is light. The writing style is fun and even pokes fun at Excel at times, with its Bubblegum-colored crayons, volatile proclivities, missing menus, and sundry other idiosyncrasies.
- You will learn to automate. Manual workflows lead to errors, departures from branding, and wasted effort. You’ll learn how to create themes, global templates, and chart templates that can be shared across an organization. And you will see how I use the U.S. Department of Justice as a cautionary tale of how embarrassing it can be if you don’t have these processes in place or anyone to act as the organization’s keeper of the data.

Tutorial Breakdown
When you get to chapter 5, where all the visualization tutorials are, each chart type has a predictable group of sections:
- AKA: Learn other names a chart type might go by.
- Uses: Learn potential uses for each chart type.
- Tips: Learn about potential design gaffes to avoid, pivot table requirements, limitations, crash warnings, alternative charts should your data not work, etc.
- Category/Metric: Learn how many categories and metrics each chart requires. There’s no sense chasing down a cool chart, just to find out your data doesn’t meet the minimum requirements.
- Tutorial: Learn how to create each chart type with illustrated steps.
- Variation(s): Learn how to add finesse some charts with optional enhancements.
- Example File: Learn the filenames for the free raw data and/or optional full Excel files.
- Template(s): Learn the filenames for the chart templates available for purchase in the store.
Not every chart has alternative names, but if I found one called by other names I included it (or them) in the book. Why would I do that? Well, when I was conducting the research for the book, there were times it was tough to find information about a particular chart type because it would be called by other names in various posts and resources. To make it as easy as possible for you to learn more about a chart type, I gave you these other names. Separate them by OR in a search engine and you’ll broaden your scope of web results.
Also Introducing the Annielytics Chart Picker
When I was finished with the book, I was still uneasy with the learning curve associated with picking the right chart type for your data. Sure, a few dataheads will go off the rails and read the book cover to cover (?♀️), but most will want to use it as more of a desktop reference.
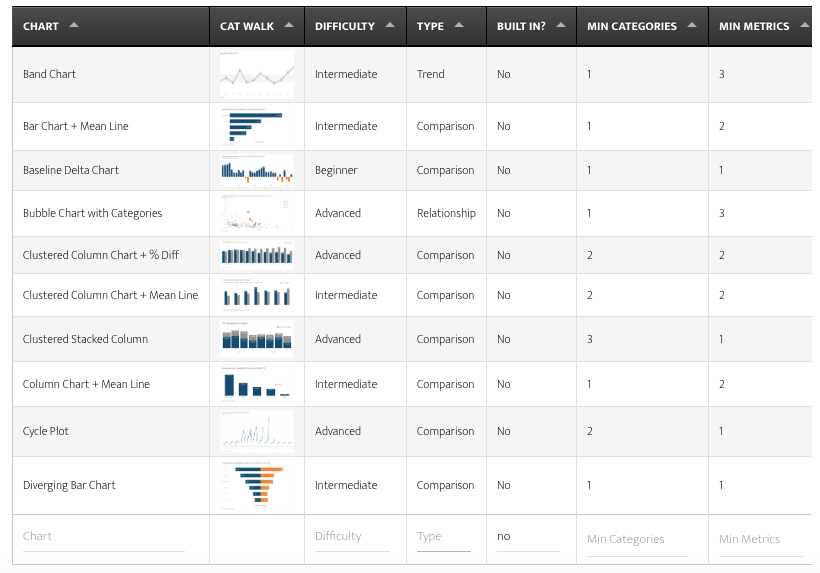
I tried creating a flowchart, but there were too many overlaps to help users simplify the decision-making process. So I settled on a table you can filter by a number of criteria:
- Difficulty
- Type
- Built In or Custom
- Minimum Categories
- Minimum Metrics
So, let’s say you have some department data and want to see what chart options you’d have that aren’t offered in Excel’s ribbon. You would see these chart options.

Price
Print Book
You might think it’s odd to address price in a blog post about a book. But I’m doing so anyway because when I submitted the price to Amazon, their automated tool pretty much intimated that I was crazy if thought I was going to be able to offer a 300-page, full-color book for that amount and gave me my minimum price.
Aside: I do think it’s funny that Amazon asks what you think the book should be sold for before letting you know the minimum price you need to charge.

This is why the vast majority of Excel books are printed in black and white. However, it’s kind of tough to talk about making data sexy using gray tones.
Ebook
To combat this, I set the price of the ebook at $19.95. I actually tried to set it cheaper, but it was too large a file. Who knew Amazon charges a delivery fee based on the size of the ebook file? (And this book is many, many MBs.) This is why Bezos has a personal jet, and I ride an electric scooter. (Well, that and I’m an adrenaline junky, but this isn’t about me, okay?)
Amazon’s Random Promos
Amazon may randomly run promotions on the books. As an author, I have no say in this. I was told that the price could also vary by location. Ergo, if you see one of the books set to a weird price, that’s not me; that’s the Amazon algorithm.
Word About Kindle Format
Because of the sheer number of images in the books, I needed to go with the print replica format (what’s recommended for textbooks). So the book is fixed format (as opposed to text-only books that reflow). This will make the book easier to use from larger devices but will not be readable on smaller devices (such as mobile phones)—at least not without panning and scrolling.
Also, print replicas cannot be accessed from all Kindle devices. At the time of writing, Amazon’s list of compatible devices includes:
Fire Tablets
- Kindle Fire HDX 8.9”
- Kindle Fire HDX
- Kindle Fire HD (2nd Generation)
- Fire HDX 8.9 Tablet
- Fire HD 7 Tablet
- Fire HD 6 Tablet
- Kindle Fire HD 8.9″
- Kindle Fire HD (1st Generation)
- Kindle Fire (2nd Generation)
- Kindle Fire (1st Generation)
- Fire HD 10
- Fire HD 8
- Fire
Kindle Apps
- Kindle for Android Phones
- Kindle for Android Tablets
- Kindle for iPhone
- Kindle for iPod Touch
- Kindle for iPad
- Kindle for Mac
- Kindle for PC
Again, just because it can be accessed from smaller devices does not mean you will have a positive user experience.
Shut Up And Take My Money!
Fine! Sheesh! Just head on over to the Making Data Sexy website. ?
Annie is back. Hurray!
And the book is out. Hurray, hurray!
???
I need definitelly buy this book!
I agree! 😀